Field Sites & Data
Field Sites
This web-app shows the sites where we operate eddy covariance flux towers and flux chamber sites in wetlands across southern Quebec.
Click the elements in the map for more information.
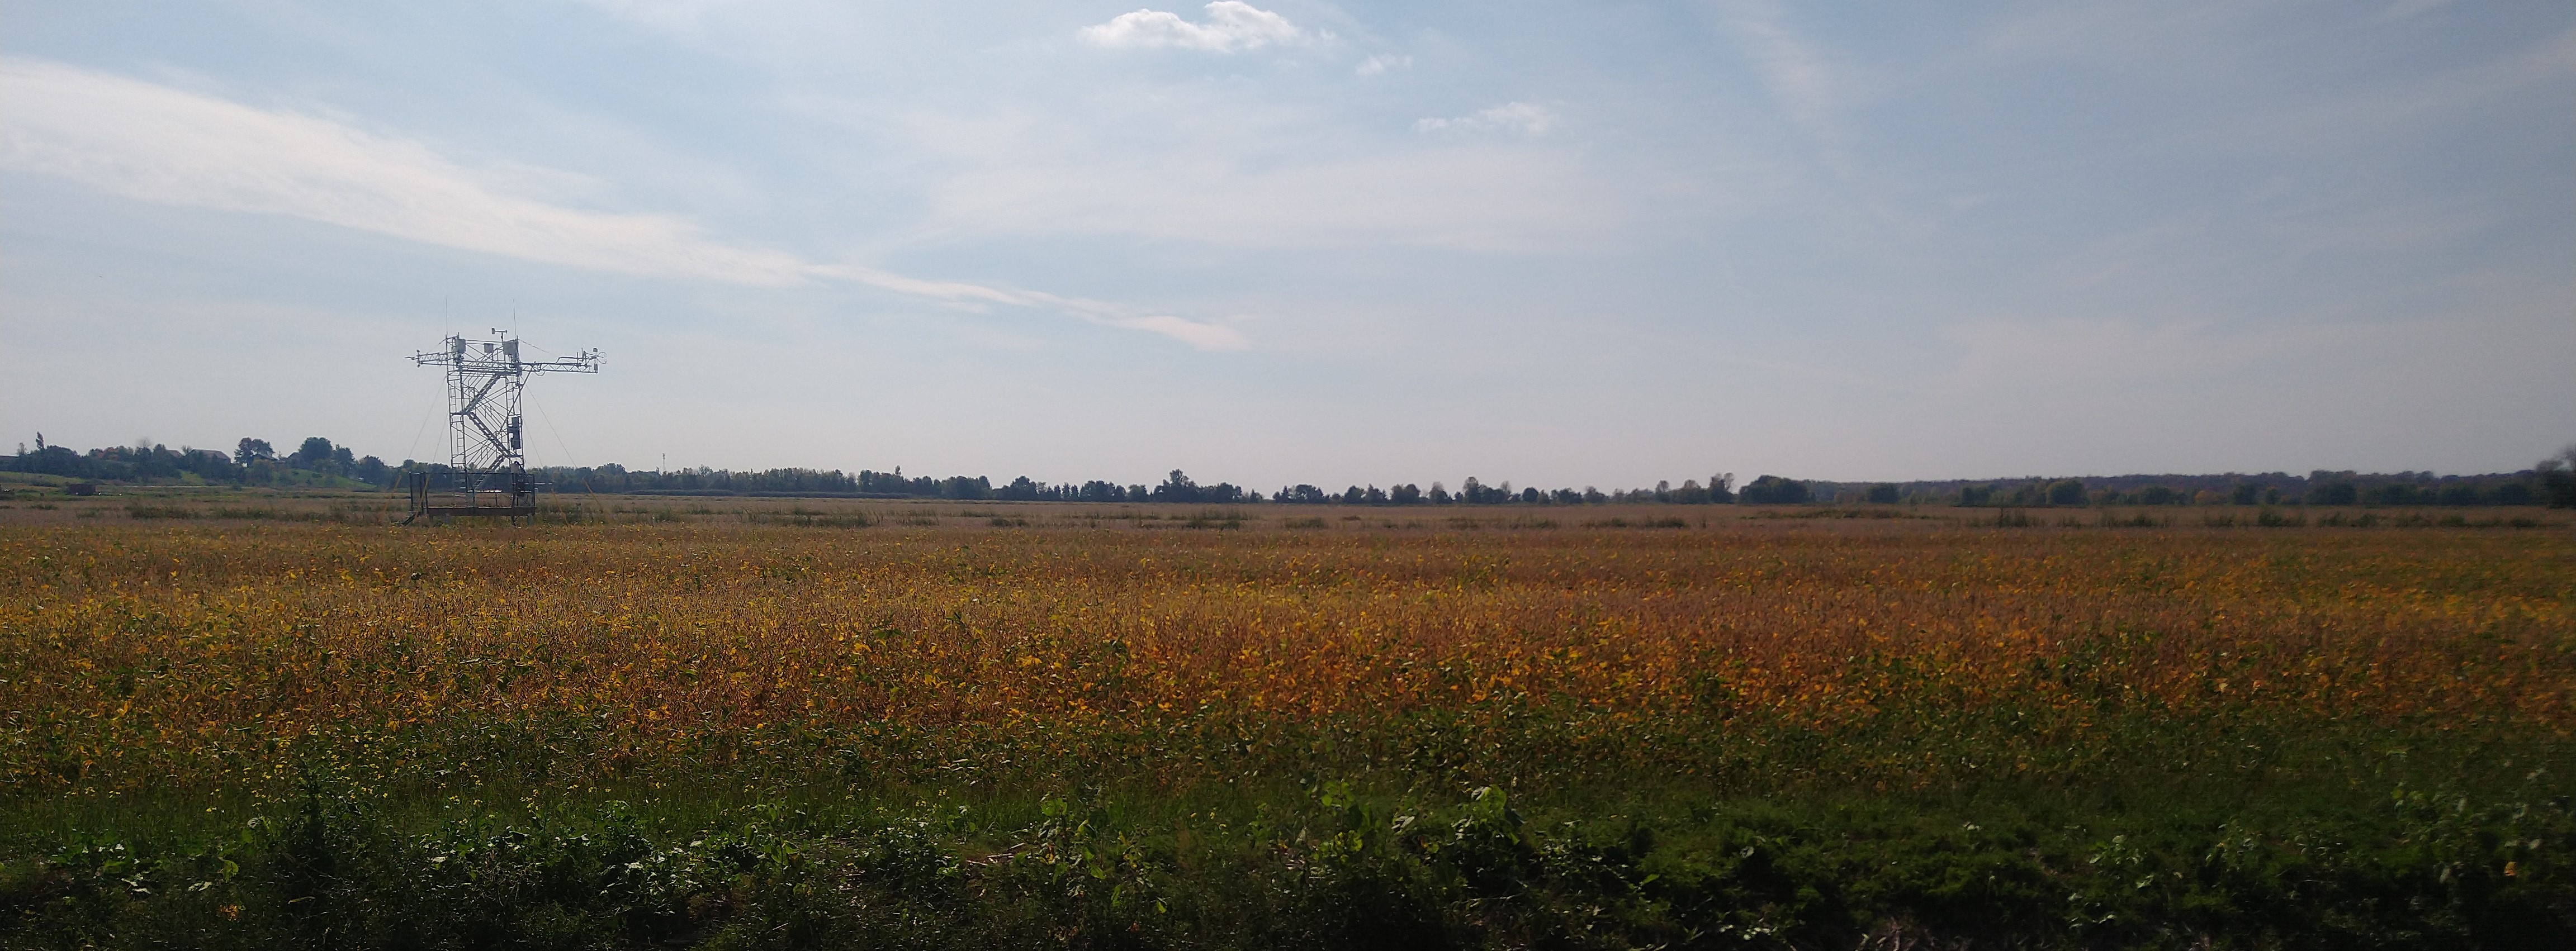
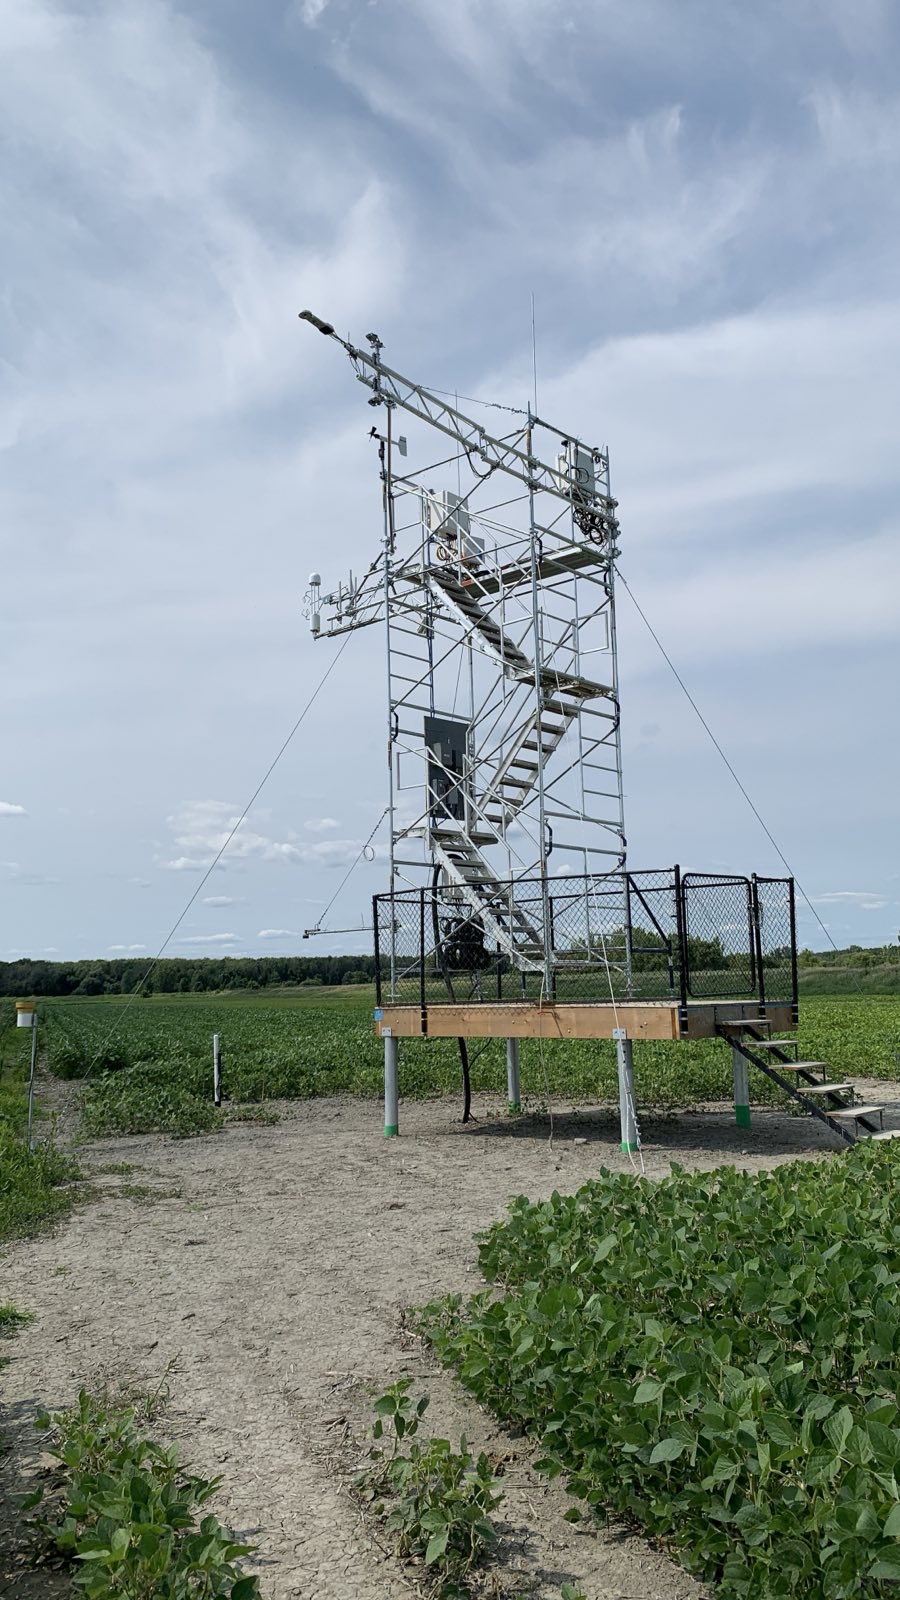
Lac Saint-Pierre transformed marsh (UQAM_1)
- A flux tower was installed in summer 2024
- Get an impression of the site conditions in near real-time on the Phenocam Network website
- Data download for CA-CQ1 will be available in the future through Ameriflux
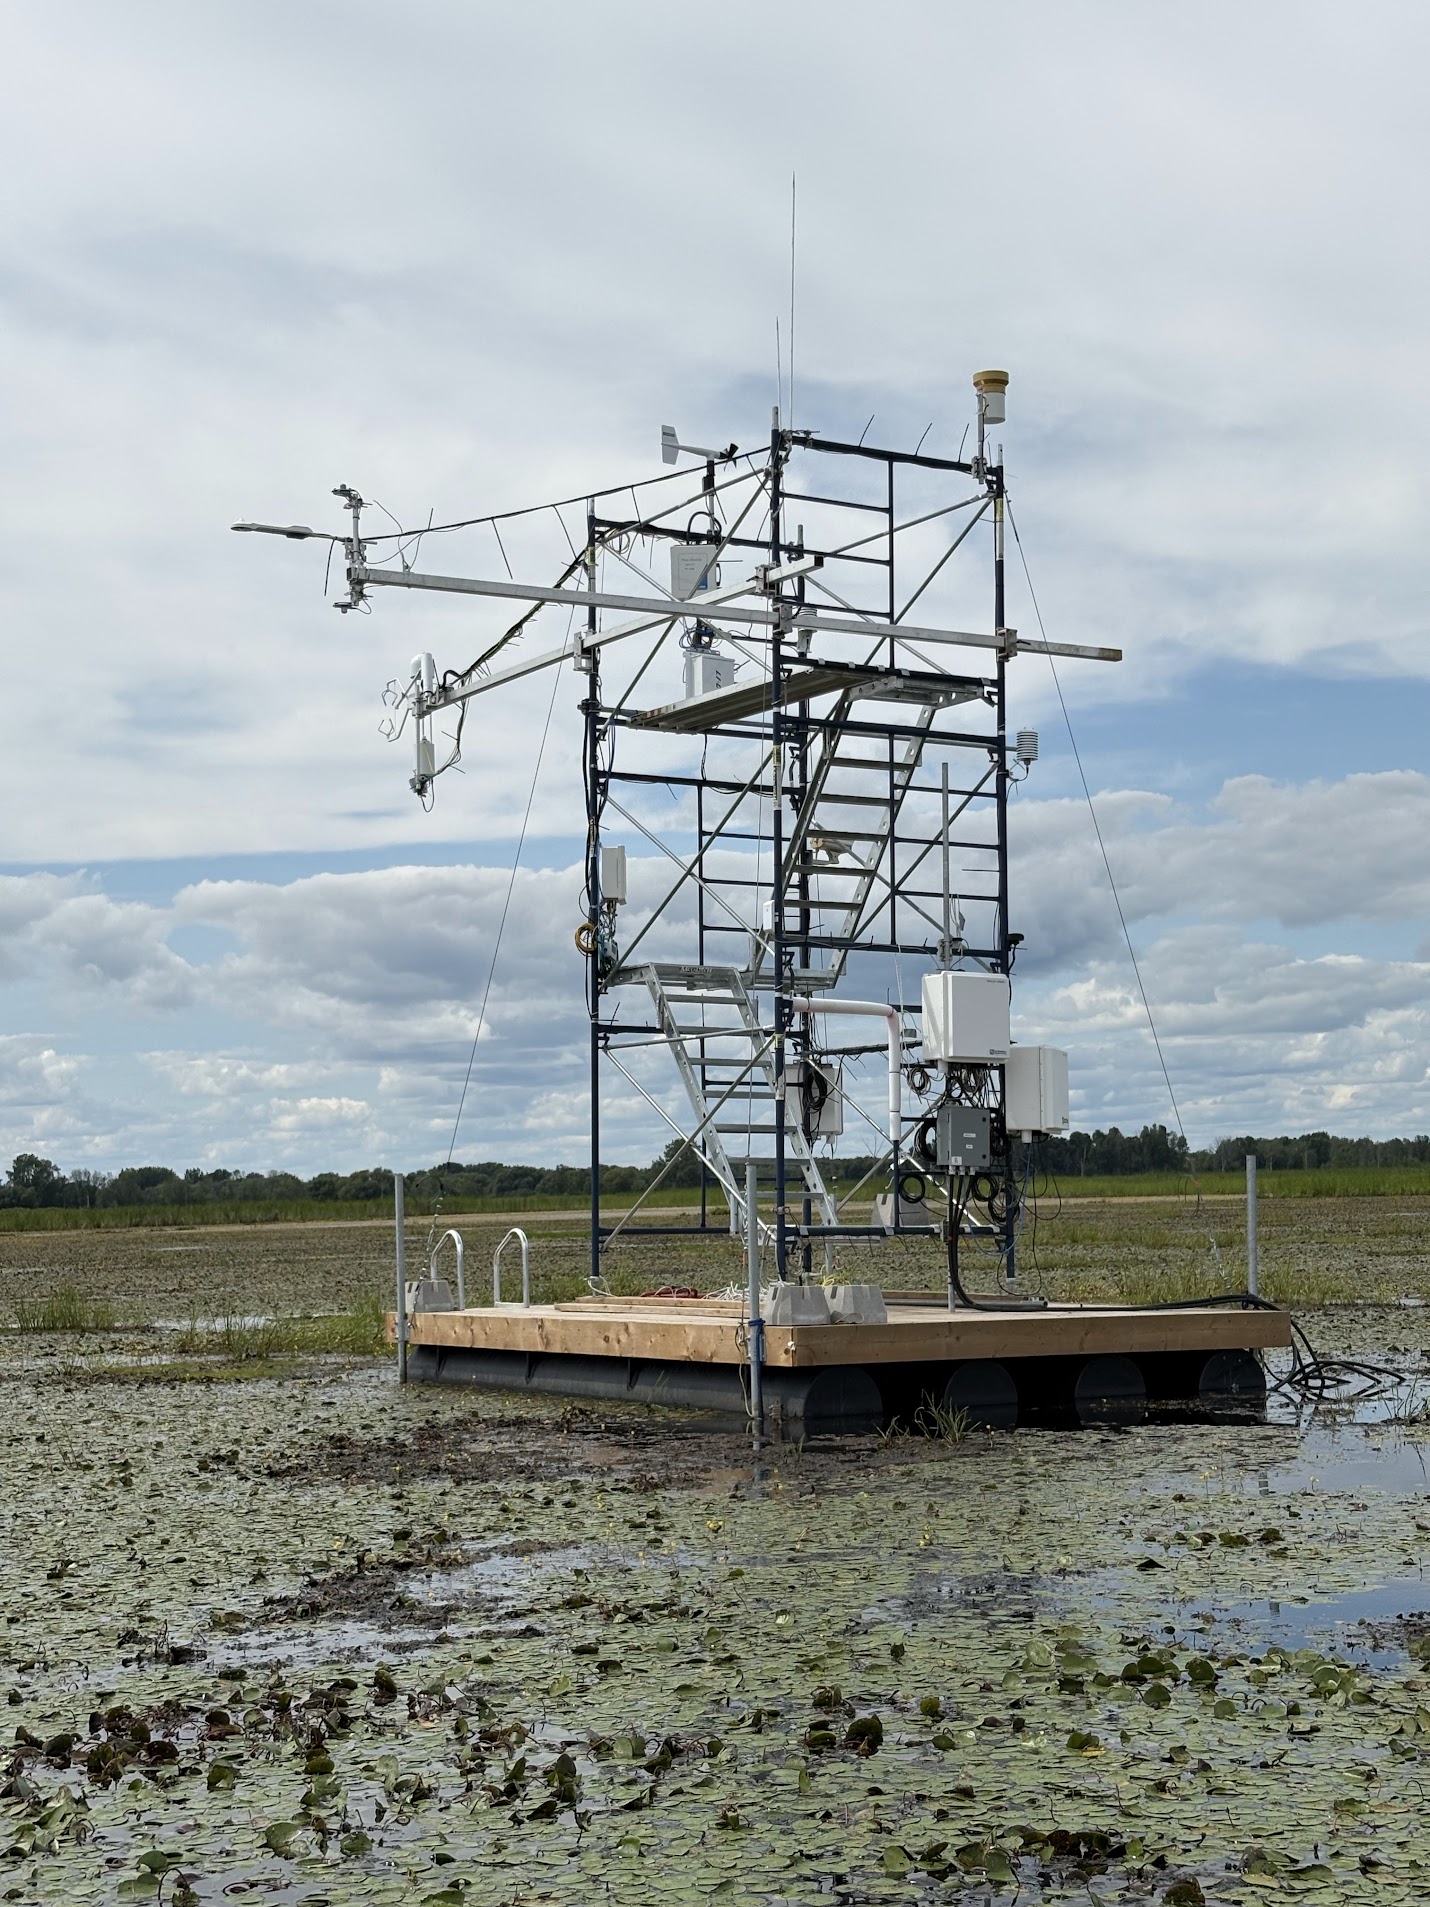
Lac Saint-Pierre restored marsh (MCGILL_1)
- A flux tower was installed in spring 2025 and became operational in early summer 2025
- Get an impression of the site conditions in near real-time on the Phenocam Network website
- Data download for this flux tower will be available in the future through Ameriflux
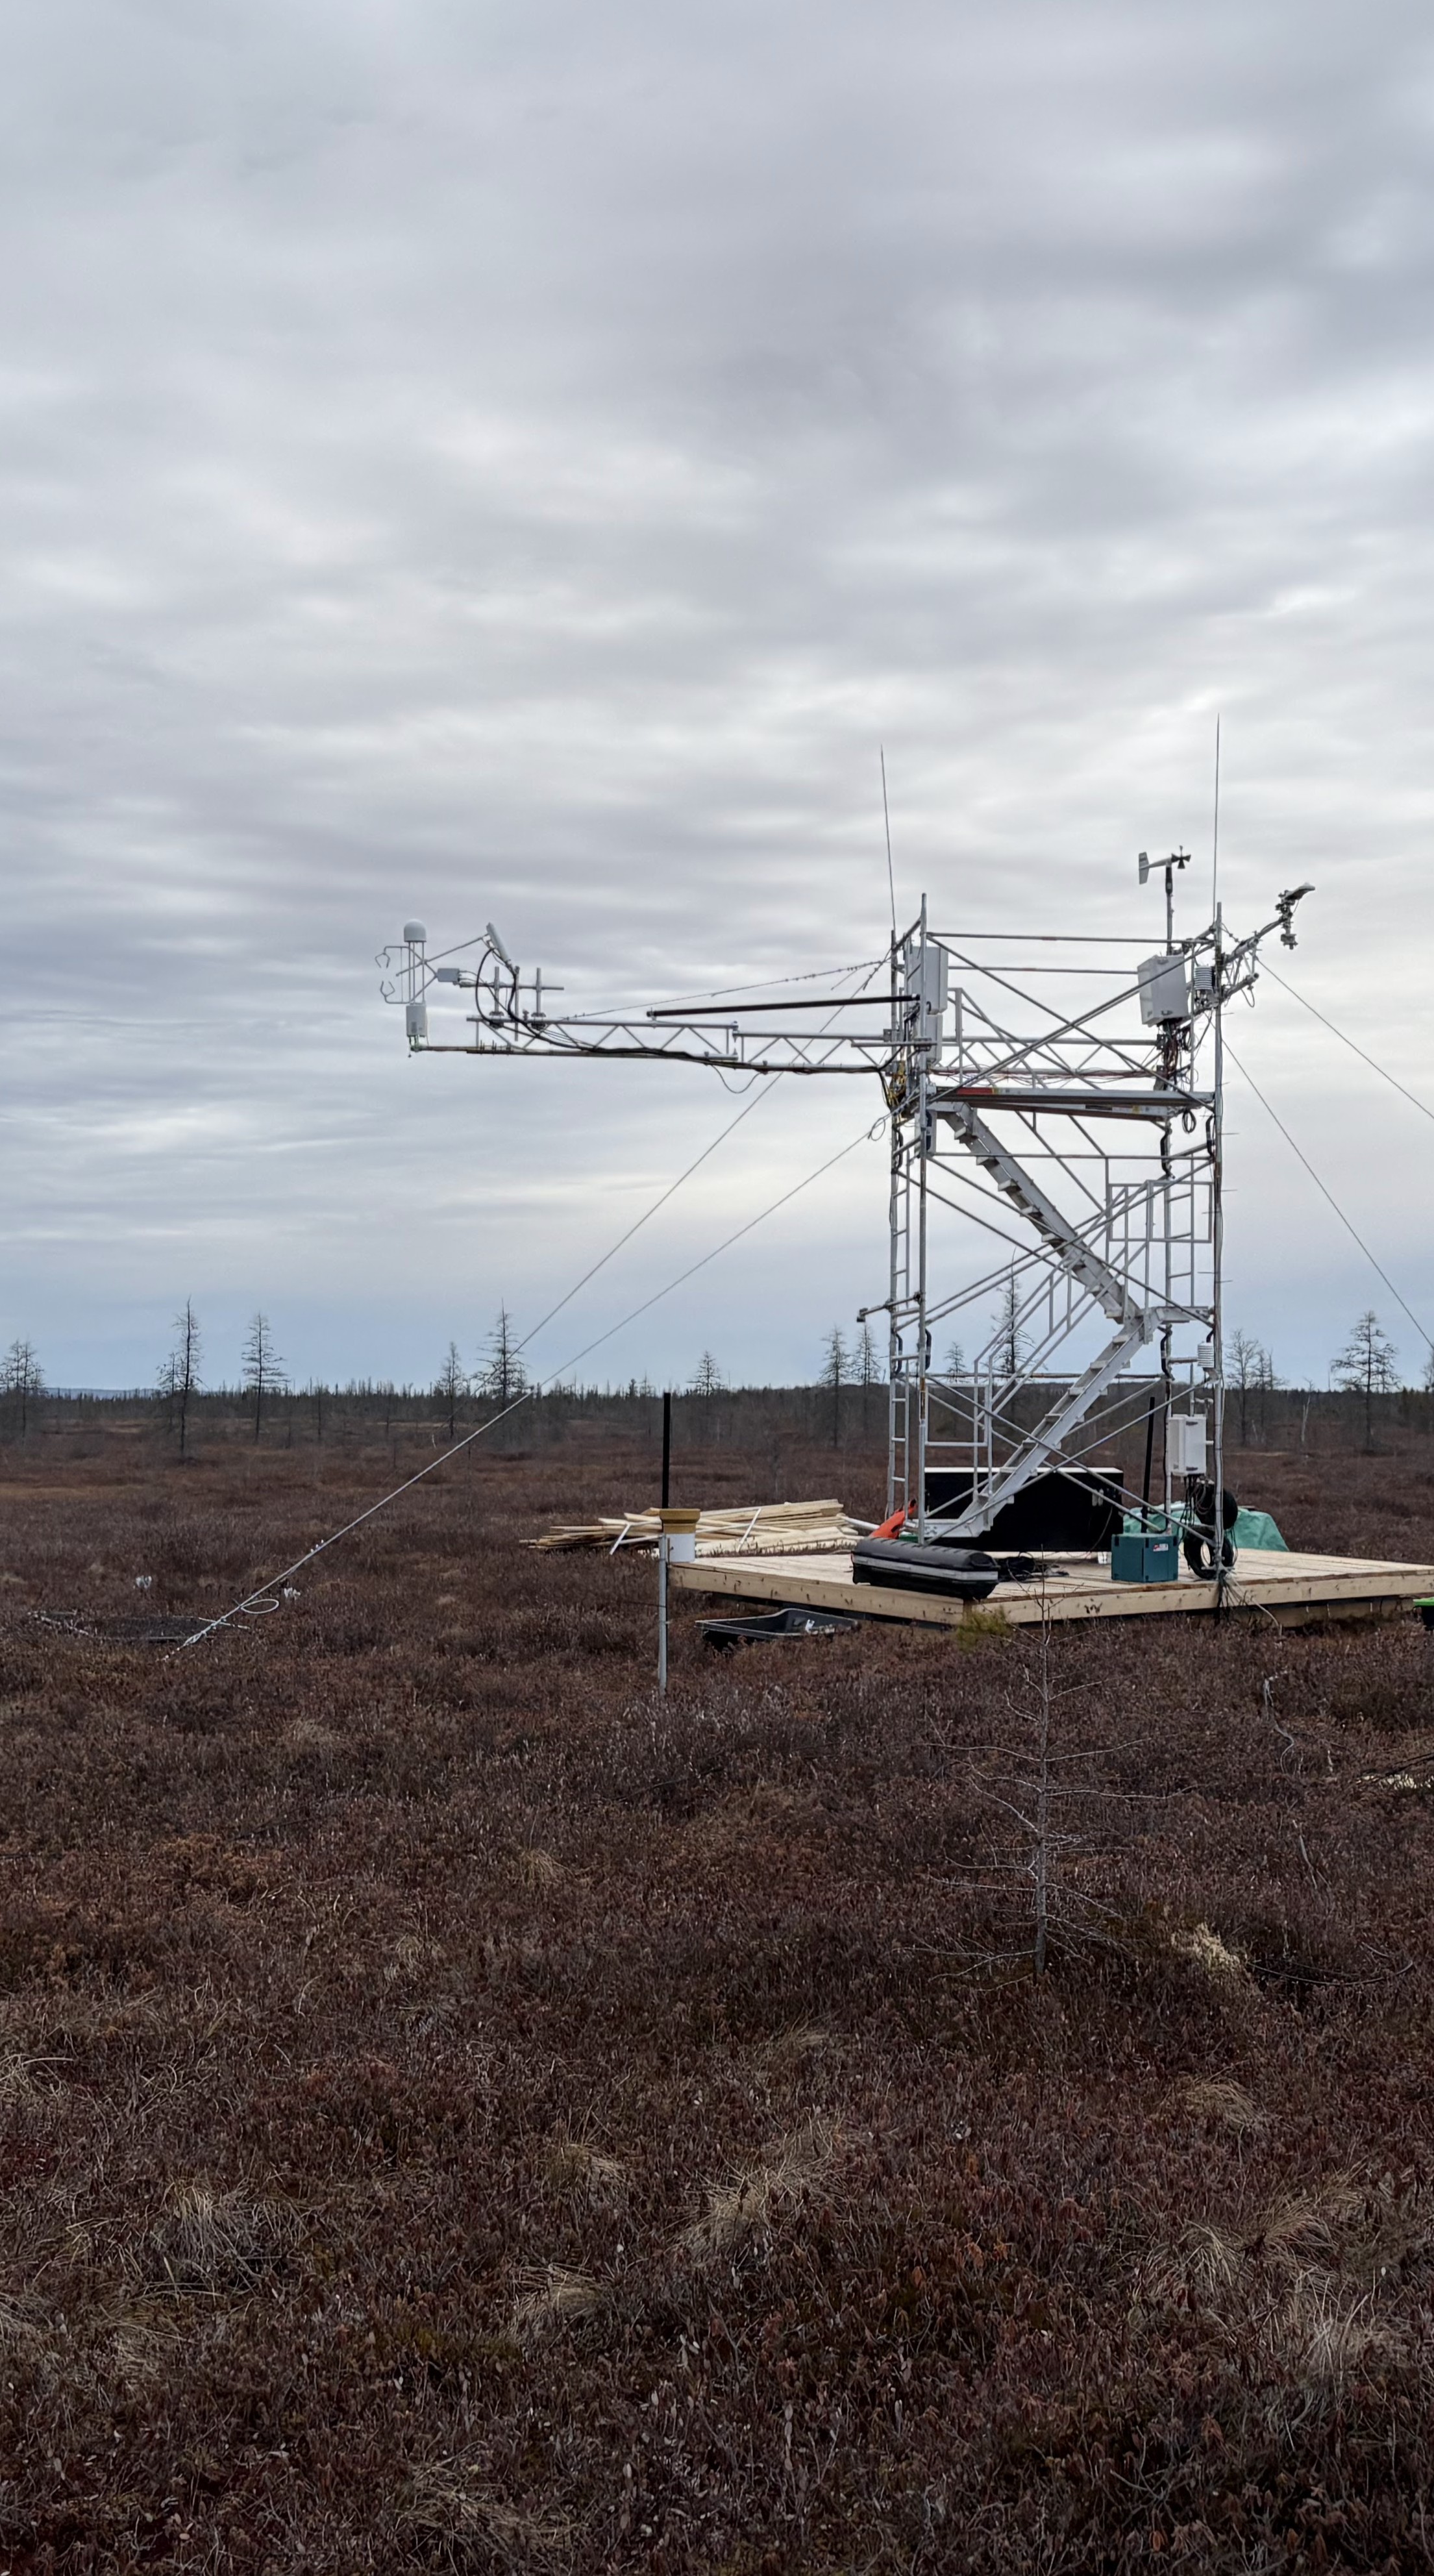
Lac-à-la-Tortue natural open bog (UQAM_2)
- A flux tower was installed in spring 2025
- The flux tower was struck by lightning briefly after the installation
- flux instruments were re-installed in July 2025 and the tower became fully operational again
- biomet sensors were working throughout
- Get an impression of the site conditions in near real-time on the Phenocam Network website
- Data download for CA-CQ2 will be available in the future through Ameriflux
Lac-à-la-Tortue natural forested bog (UQAM_3)
- A flux tower was installed in spring 2025
- Get an impression of the site conditions in near real-time on the Phenocam Network website
- Data download for CA-CQ3 will be available in the future through Ameriflux
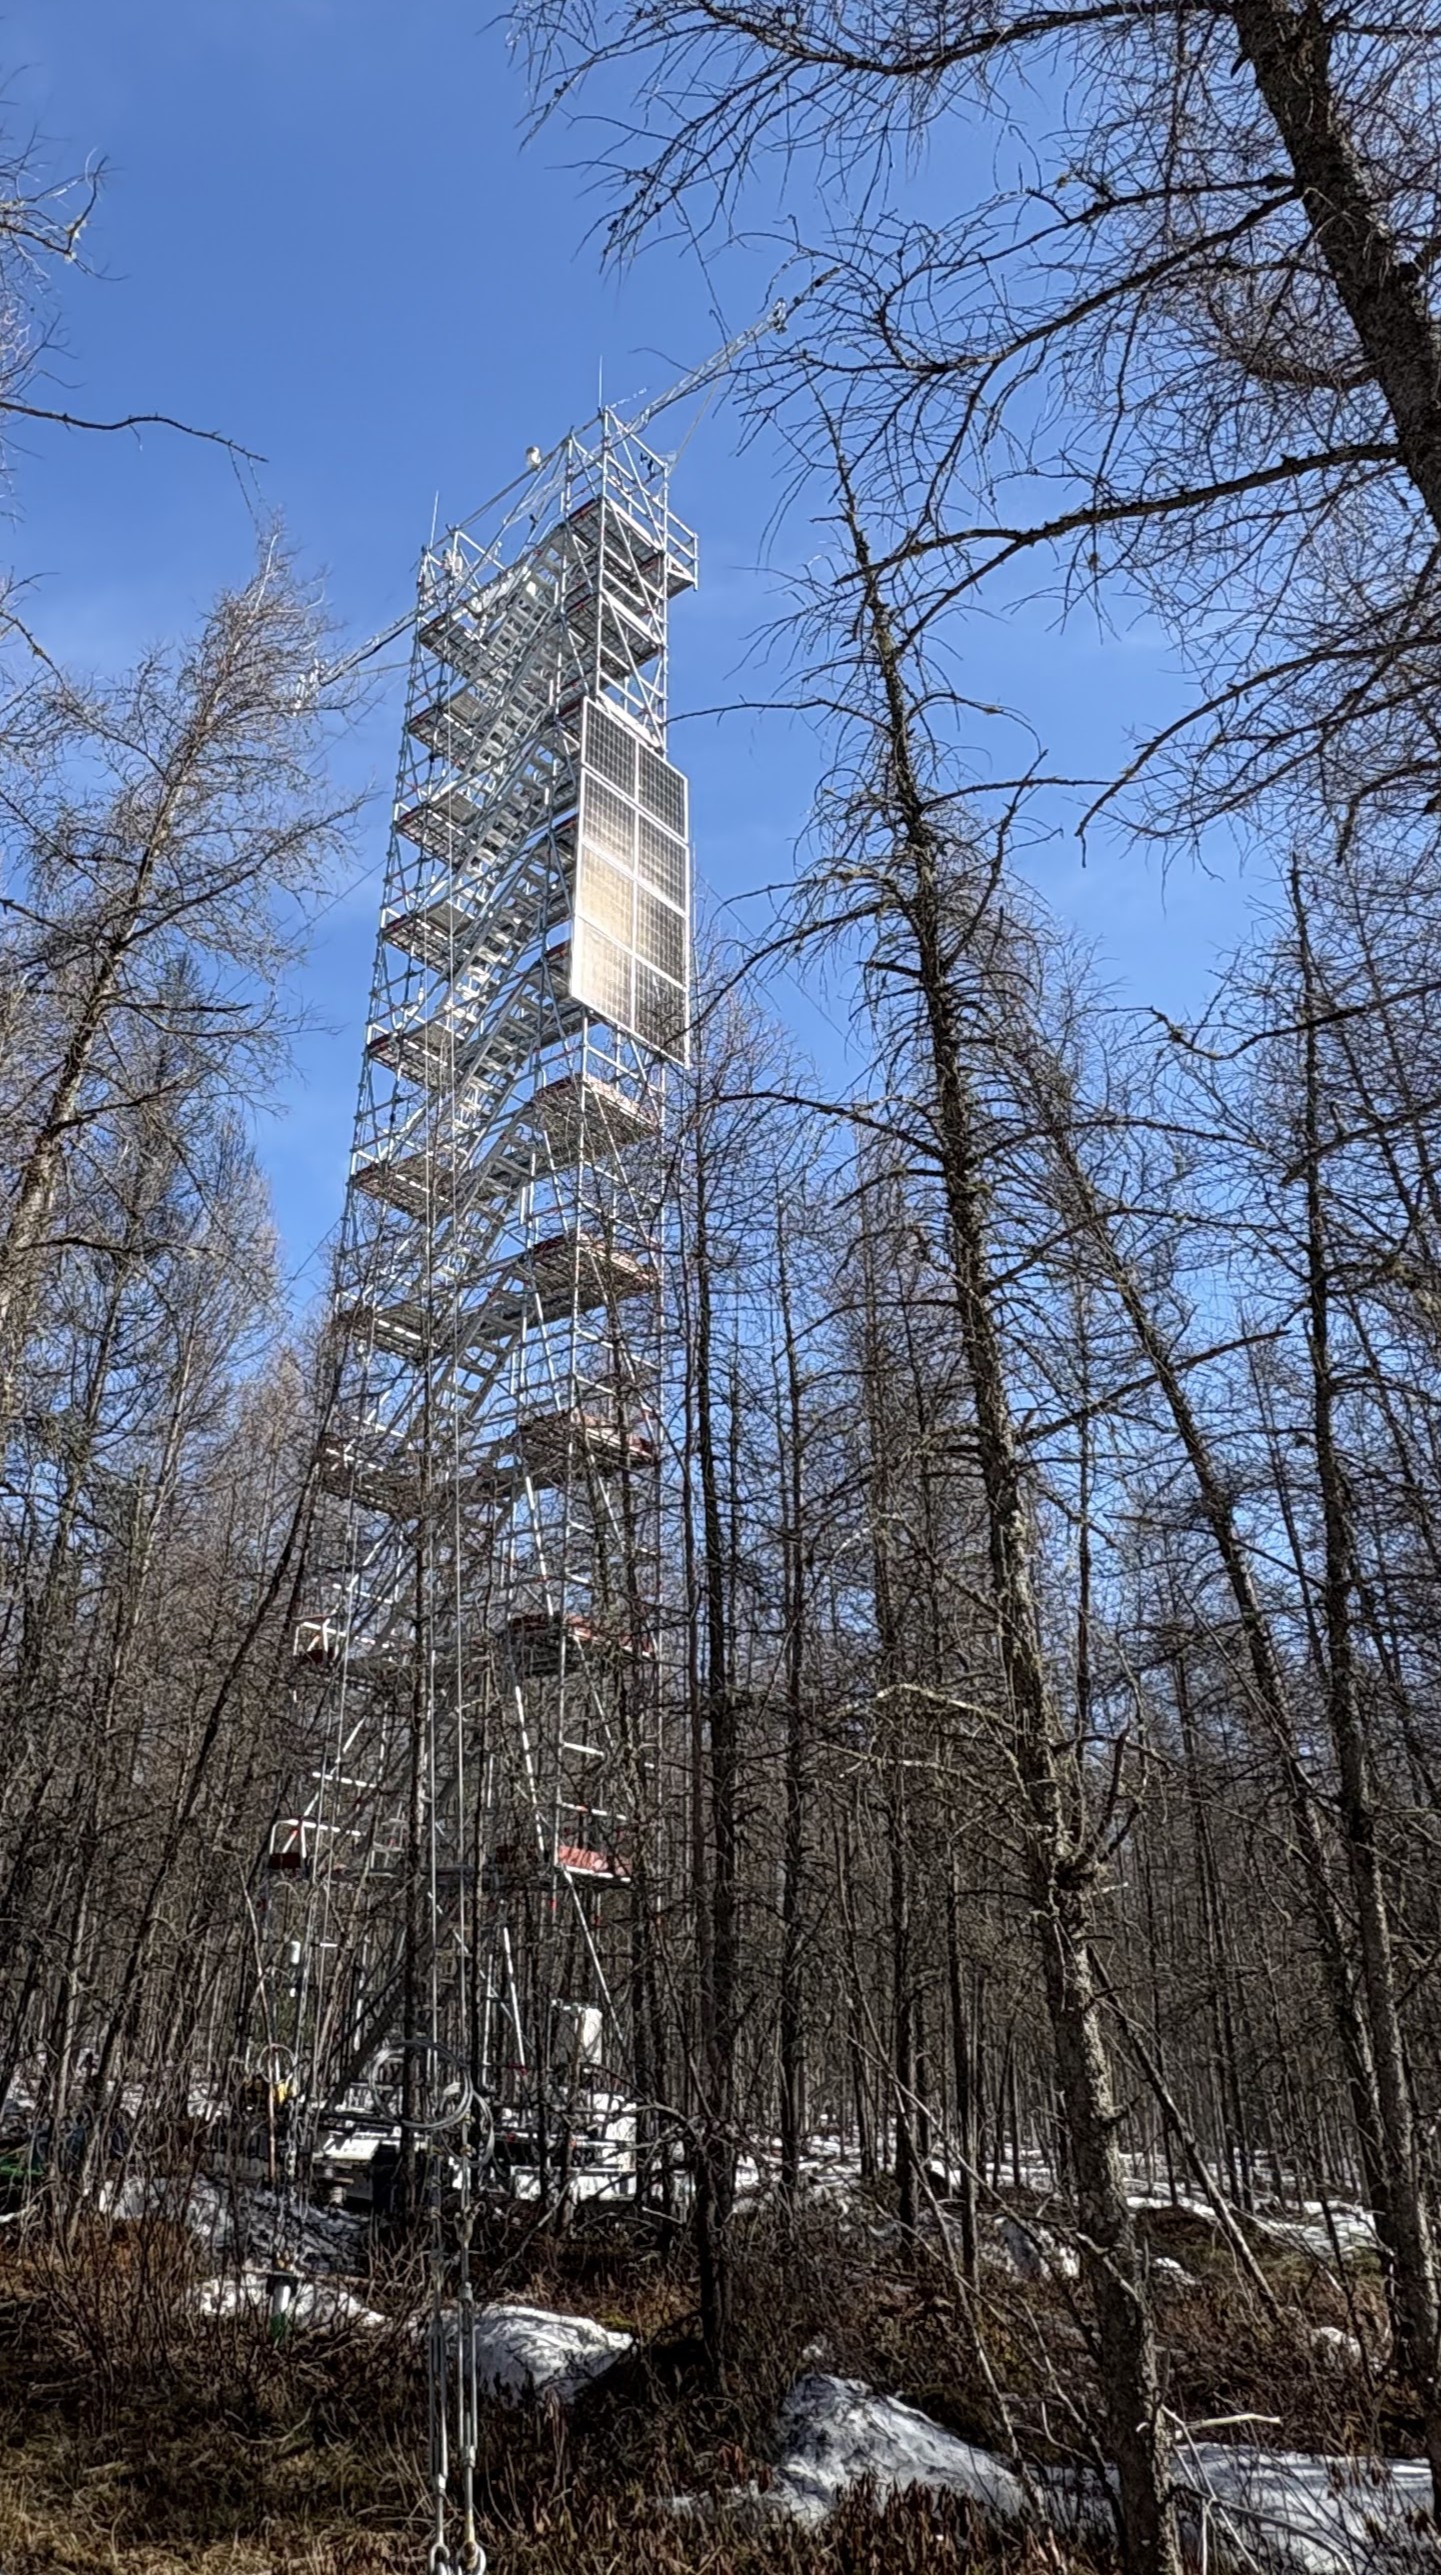
Montérégie transformed forested peatland (UQAM_4)
- A flux tower was installed in January 2026
- Get an impression of the site conditions in near real-time on the Phenocam Network website
- Data download for CA-CQ4 will be available in the future through Ameriflux
- Collaboration with the Partnership Research Chair in the Conservation and Restoration of Cultivated Organic Soils and Montérégie Farms associated with the Research Chair
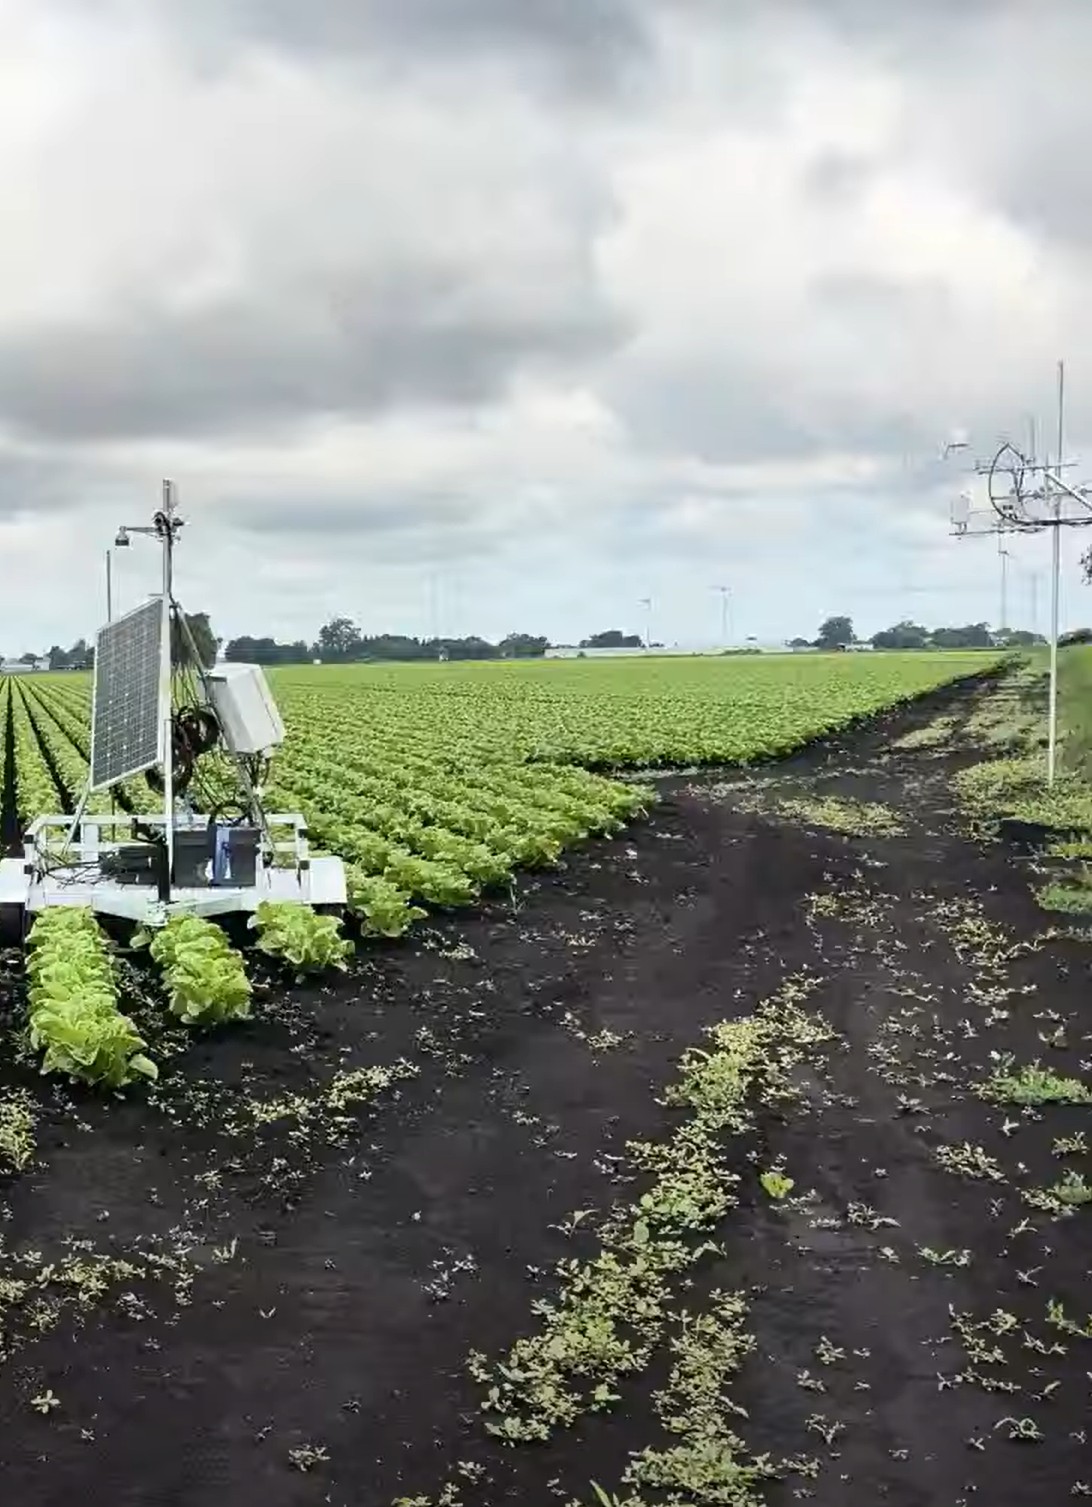
Baie Saint François natural marsh (UQAM_5)
- The platform infrastructure was installed in November 2025 and the site was instrumented in the summer of 2026
- Get an impression of the site conditions in near real-time on the Phenocam Network website
- Data download for this flux tower will be available in the future through Ameriflux
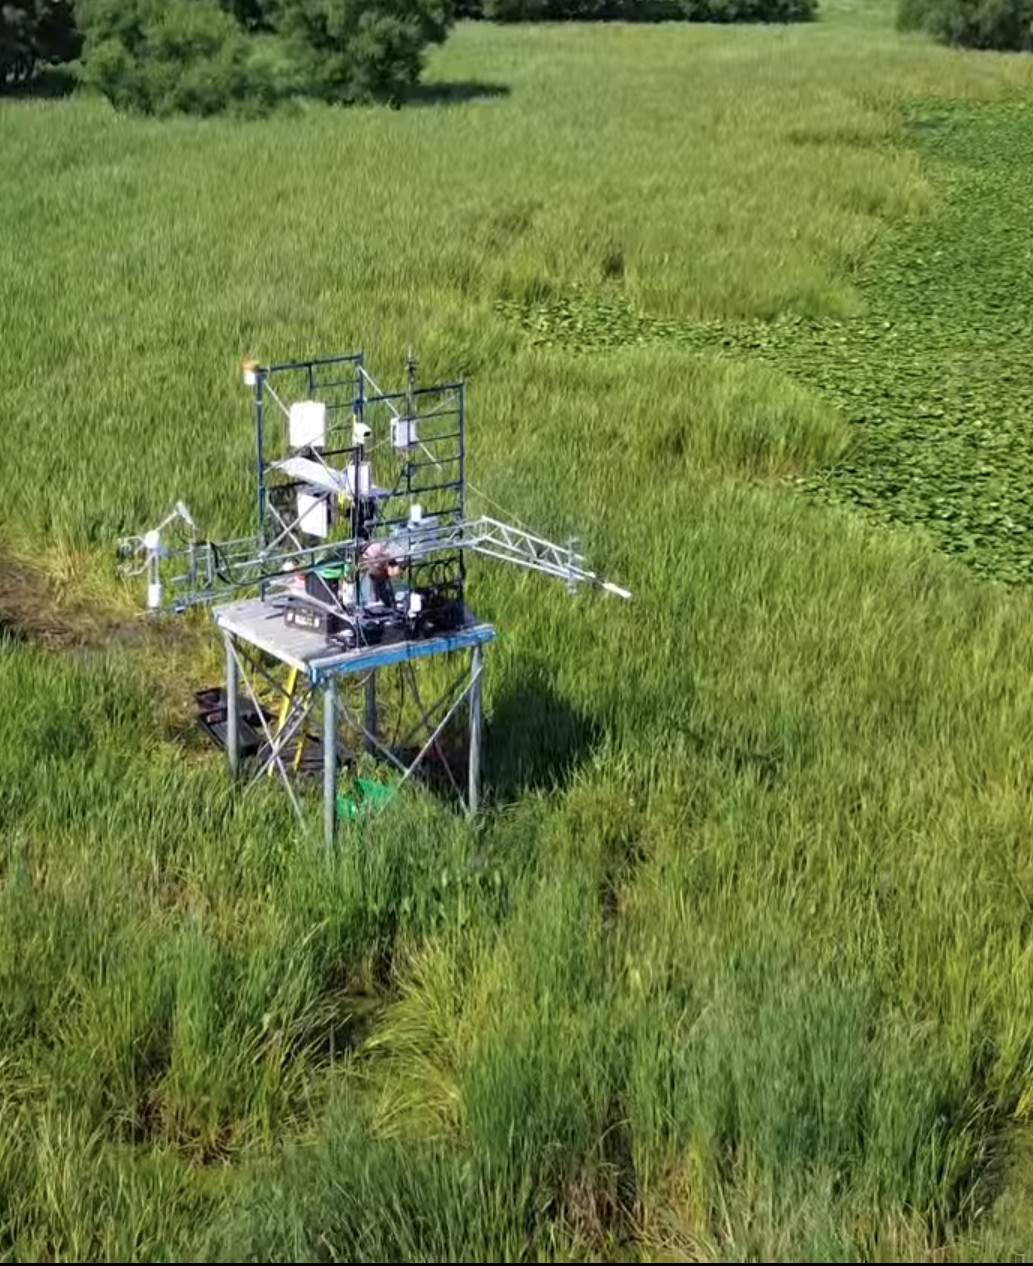
More documentation related to maintenance procedures for our sites can be found here.
Data
This data visualization tool shows data recorded at our eddy covariance flux towers in southern Quebec.
Please use the drop-down menus to select the site and variable you would like to see.